|
 |
Special Application of Polarized Light Based Analysis
– A Few Examples (Ref: Ellipso Technology) |
|
| |
|
|
1. Thick film |
|
1.1 Cover Layer & Space Layer of Blu-Ray Disk |
[TOP] |
|
|
| |
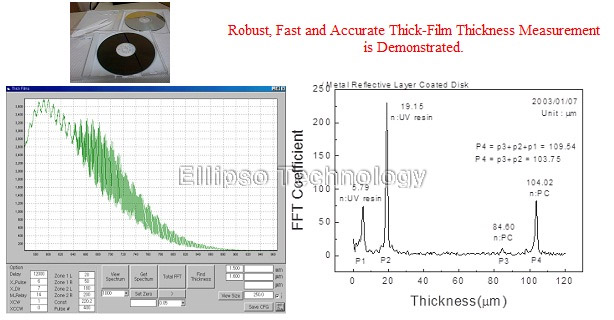
m-FFT Analysis Technique is Applied to a Prototype Blu-Ray Disc with Thick Cover Layer, Space Layer and UV Resin. |
| |
 |
| |
| Thickness of |
SL |
5.79 um |
| |
Resin |
19.15 um |
| |
CL |
84.60 um |
| |
Resin+CL |
103.75 um |
|
|
|
|
|
| |
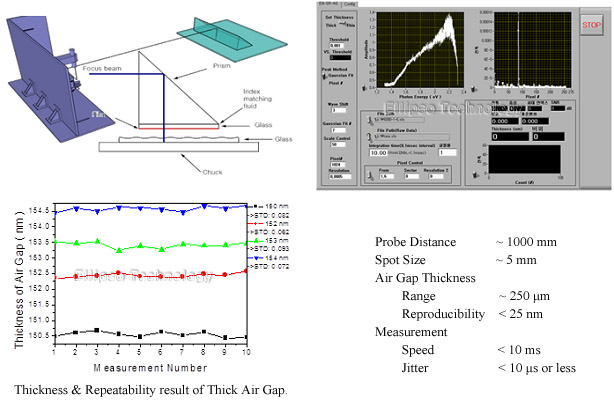
Ultra high speed measurement system(10 ms/1 Point) with mFFT analysis technique is applied to Thick Air Gap between Prism and Glass Substrate. |
| |
 |
|
2. Phase Change Films |
|
2.1 ZnS+SiO2 on c-Si |
[TOP] |
|
|
| |
 |
| |
| ZnS(79.5 %) + SiO2(20.5 %) |
205.9 nm |
| Substrate |
Crystalline Silicon |
|
|
|
2.2 The Complex Refractive Index of GST(Ge2Sb2Te5) |
[TOP] |
|
|
| |
|
| |
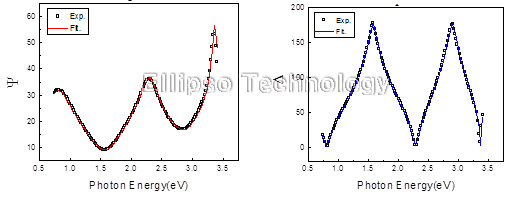
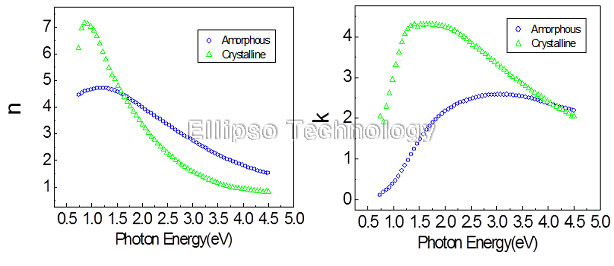
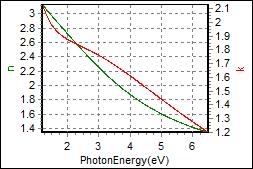
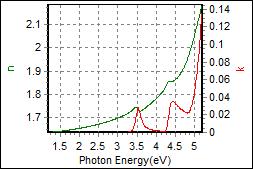
The real part(upper left) of the complex refractive index of amorphous Ge2Sb2Te5(green triangle) and that of crystalline Ge2Sb2Te5(blue circle), and the imaginary part(upper right) of the complex refractive index of amorphous Ge2Sb2Te5(green triangle) and that of crystalline Ge2Sb2Te5 (blue circle). |
|
|
2.3 The Complex Refractive Index of Sb-rich GST(Ge2Sb2+xTe5) |
[TOP] |
|
|
| |
 |
| |
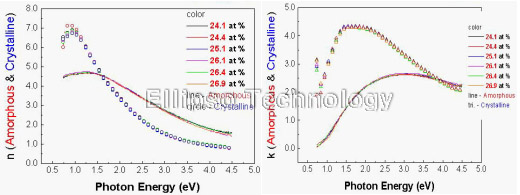
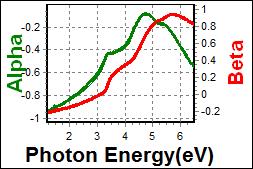
Even though the crystallization kinetics varies quite drastically on Sb addition to Ge2Sb2Te5, the complex refractive index of Sb-added Ge2Sb2Te5 does not show any appreciable change even Sb fraction is increased from 24.1 % to 26.9 %. |
|
|
2.4 The Complex Refractive Index of GST-N(Nitrogen Doped Ge2Sb2Te5) |
[TOP] |
|
|
| |
|
| |
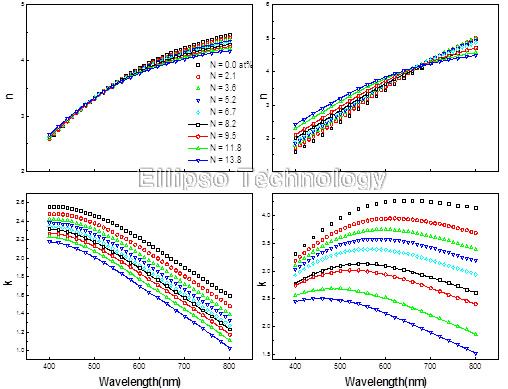
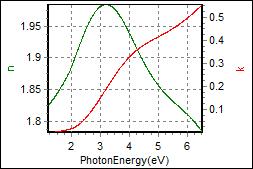
The complex refractive of Ge2Sb2Te5 varies gradually as Nitrogen concentration is increased from 0.0 % to 13.8 %. Nitrogen doping into Ge2Sb2Te5 is done for the purpose of improving its stability in read-write cycle. Nitrogen doped upto 3.6 % intoGe2Sb2Te5 maintains stable reversible phase transition even after 100,000 cycles of read-write execution. |
|
|
2.5 The Complex Refractive Index of Al-Cr |
[TOP] |
|
|
| |
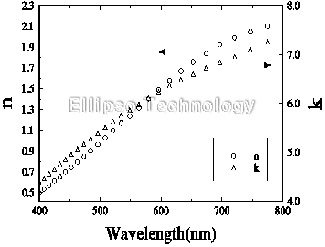 |
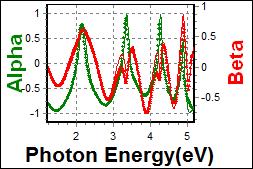
The complex refractive index of a reflective layer consisted of Al-Cr. |
|
|
|
2.6 Super-RENS Application of PtOx : The Complex Refractive Index of PtOx |
[TOP] |
|
|
| |
 |
| |
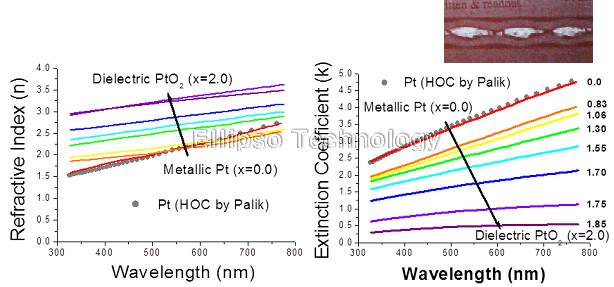
With increasing Oxygen fraction x (0~1.85), (n,k) spectra of as-deposited PtOx vary gradually from those of metallic Pt to those of dielectric PtO2. |
|
|
2.7 Super-RENS Application of PtOx : Evolution of PtOx vs Temperature Increase - 1/2 |
[TOP] |
|
|
| |
 |
| |
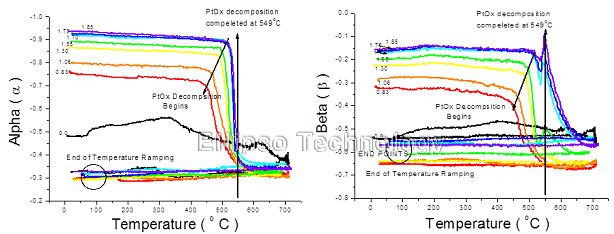
As temperature is increased, PtOx evolves in three steps of 1) Oxidation 2) Decomposition, and 3) Coalescence & Pt formation. Decomposition of PtOx is completed at 550 C. |
|
|
2.8 Super-RENS Application of PtOx : Evolution of PtOx vs Temperature Increase - 2/2 |
[TOP] |
|
|
| |
 |
|
| |
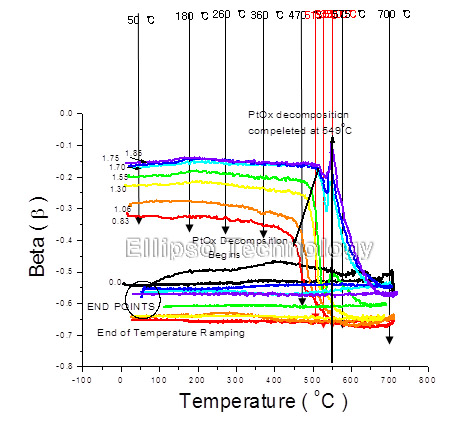
Abrupt and drastic variation of optical, structural properties are observed at T>Tdecomp and x>1.55. Tdecomp increases (440~520 °C) with increasing x (0~1.85). |
|
|
2.9 Super-RENS Application of PtOx : Temperature Variation of n,k Spectra |
[TOP] |
|
|
| |
|
| |
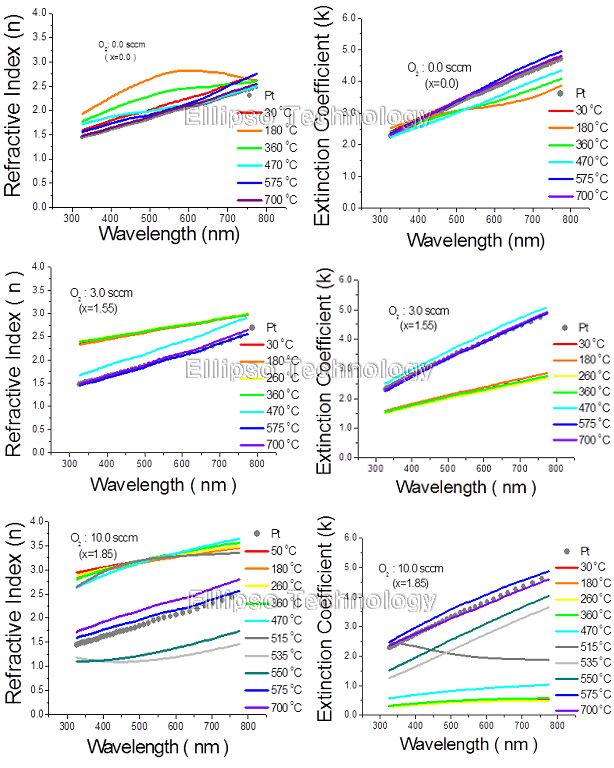
Temperature variation of (n,k) spectra of a few PtOx (0, 1.55, 1.85) show abrupt change to (n,k) of metallic Pt around Tdecomp. |
|
3. Micro Spot & Imaging |
|
3.1 Polarization Dependent Transmission Micro Profiler |
[TOP] |
|
|
| |
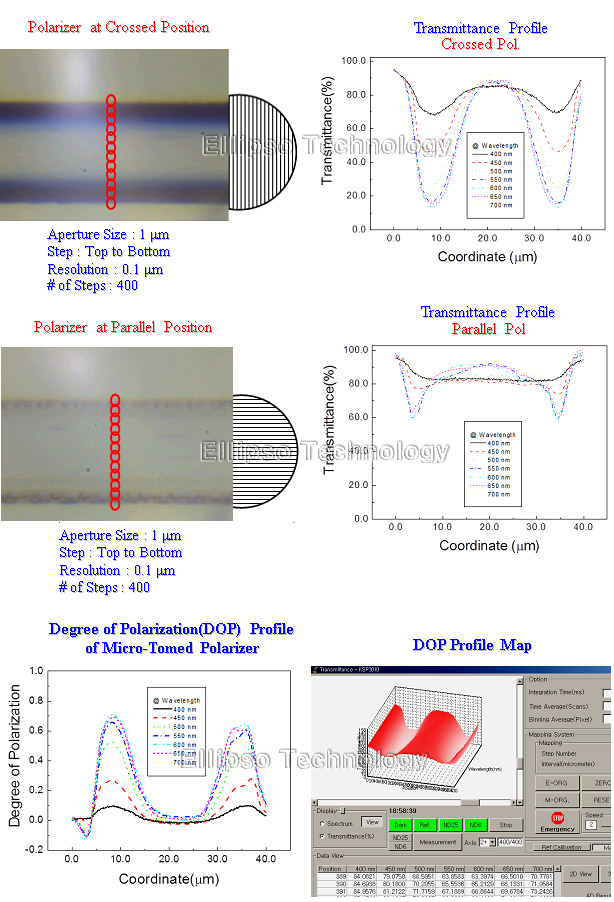
The distribution of microscopically aligned iodized-PVA in Polaroid is observed. Polaroid film is micro-tomed to 2 um thick, and polarization state dependent transmittance spectrum is microscopically profiled. |
|
| |
 |
| |
From DOP(Degree of Polarization) profile of micro-tomed polarizer at the spatial resolution of submicron and its wavelength dependence one can reveal concentration of Iodine, distribution and degree of alignment of Iodine substituted PVA together with the spectral characteristics of a sheet polarizer. |
|
|
3.2 Bio-Application of Imaging Ellipsometry to hMSCs(human Mesenchymal Stem Cells) |
[TOP] |
|
|
| |
 |
|
| |
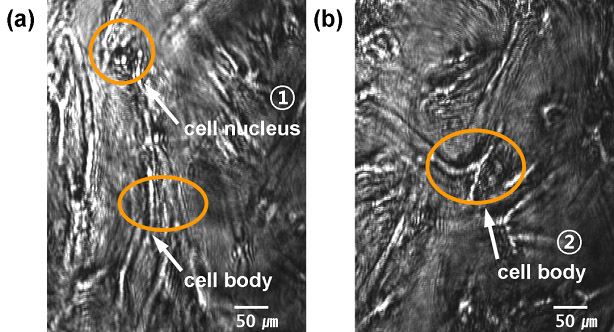
The conventional images of hMSCs(human Mesenchymal Stem Cells) showing (a) a cell nucleus and cell body, and (b) a cell body. |
|
| |
 |
|
| |
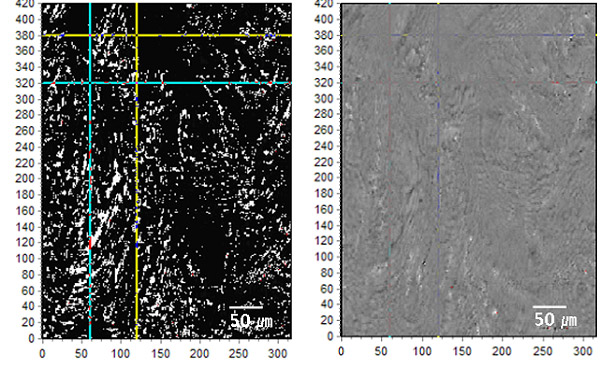
The image of ellipsometric constant Δ(left) and that of Ψ(right) of the cell nucleus and cell body, shown above. |
|
| |
 |
|
| |
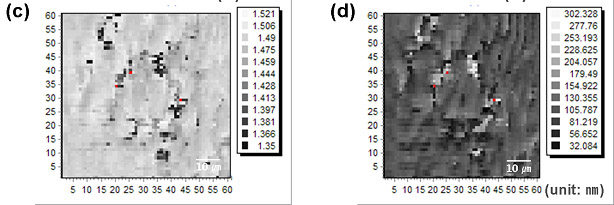
Ellipsometric constants images of the cell nucleus and the cell body around its vicinity are converted to the image of the refractive and thickness of the corresponding cell parts. Refractive index and thickness of the cell body are shown in numbers below. |
|
| |
| |
Cell nucleus |
Cell body |
| Thickness |
80~130 nm |
50~250 nm |
| Refractive Index |
1.48~1.50 |
1.33~1.51 |
|
|
4. Ultra Small Birefringence |
|
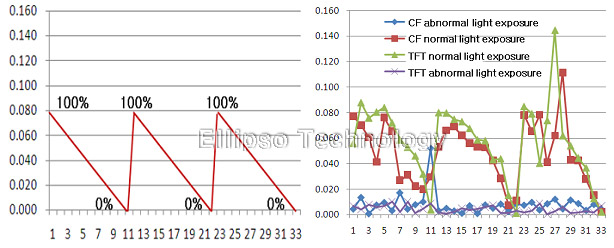
4.1 Ultra Small Birefringence of Photo-Aligned PI |
[TOP] |
|
|
| |
 |
| |
Depending on power of light exposure, Retardations of CF & TFT vary from 0.001 to 0.15 nm. Retardation of optical aligned sample shows very strong correlation with power of light exposure. |
|
|
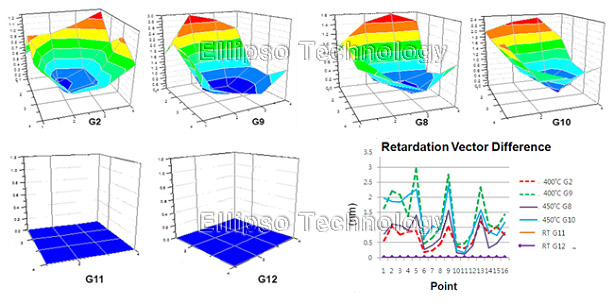
4.2 Retardation Map of Stressed/Relieved Glass |
[TOP] |
|
|
| |
 |
| |
The above maps show retardation distribution of glasses before heating process(G11, G12) and quenching process(G2, G9, G8, G10) after heating. Residual stress of Glass is expressed in terms of Retardation, which ranges from 0.1 to 3.0 nm. |
|
|
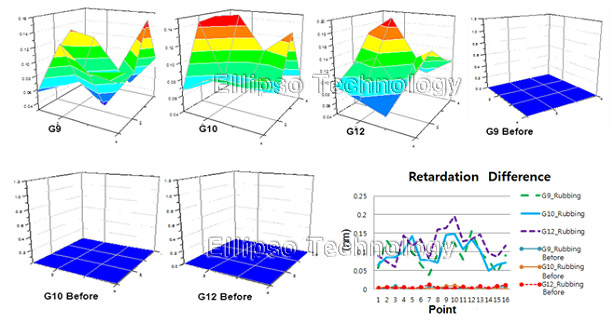
4.3 Retardation of Rubbed PI |
[TOP] |
|
|
| |
 |
| |
Retardations of Rubbed PI samples are from 0.05 to 0.2 nm, where those of un-Rubbed PI are below 0.02 nm. The effect of residual stress in glass substrate is properly substracted. |
|
|
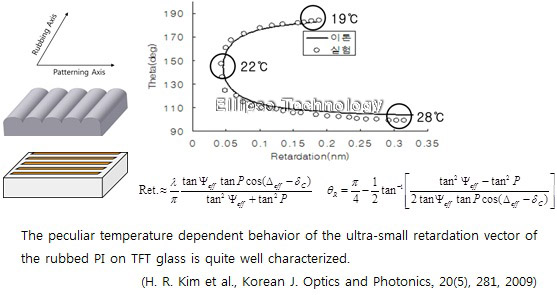
4.4 Temperature Dependent Retardation of Rubbed PI on TFT Glass |
[TOP] |
|
|
| |
 |
|
|
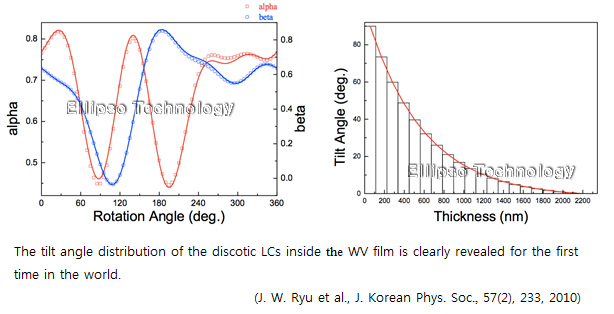
4.5 Optic Axis Distribution of Discotic LCs in WV Film |
[TOP] |
|
|
| |
 |
|
5.Optical Anisotropy in Small Spot |
|
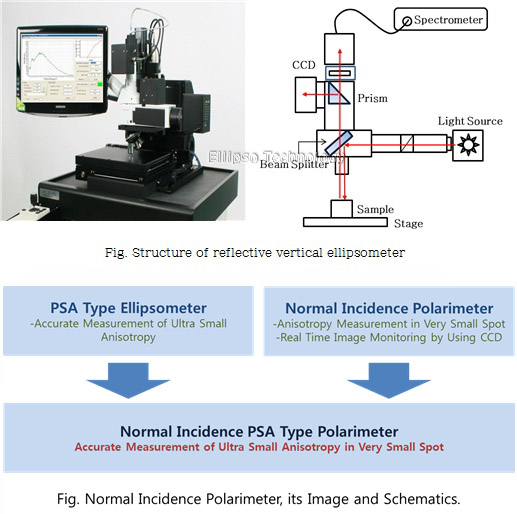
5.1 Normal Incidence Polarimeter |
[TOP] |
|
|
| |
Precise measurement of optical anisotropy in small area is made possible using normal incidence polarimeter. |
| |
|
|
|
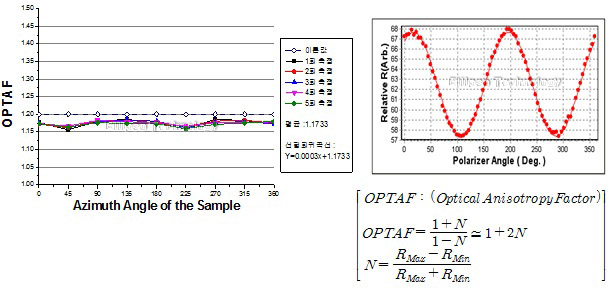
5.2 OPTAF - Accuracy and Repeatability |
[TOP] |
|
|
| |
 |
| |
Fig. Azimuth angle dependence of OPTAF of rutile(TiO2) is less than 0.015. |
|
|
|
|
| |
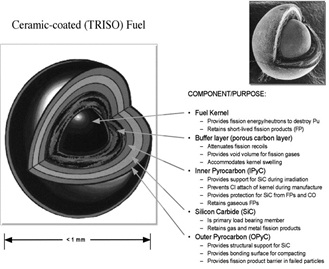
Measurement of the optical anisotropy of TRISO(Tri-isotropic) clad layer.
TRISO(Tri-Isotropic) nuclear fuel is coated with three clad layers to prevent the radiation leakage, and each layer is isotropic. But the clad layer with defect becomes anisotropic and leads to radiation leakage. By evaluating the anisotropy of TRISO nuclear fuel, one can quantize degree of defects and prevent radiation leakage accident. |
| |
 |
|
6. Spectroscopic Imaging Ellipsometer |
|
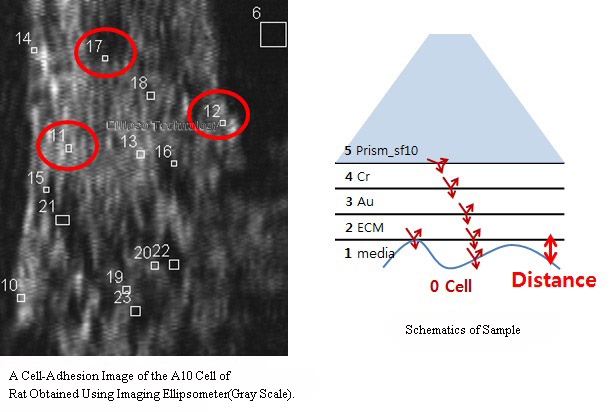
6.1 Behavior of a Living Cell Observed by Using Spectrosopic Imaging Ellipsomter |
[TOP] |
|
|
| |
Image of Cell |
| |
|
|
|
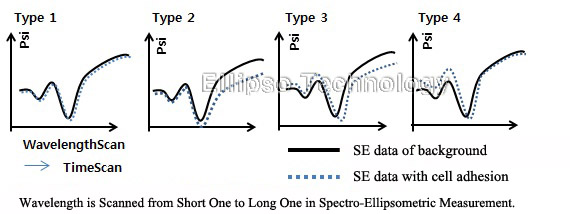
6.2 Types of Spectro-Ellipsometric Constant(Psi) Variation |
[TOP] |
|
|
| |
 |
| |
Type 1 : No Variation. Psi spectrum is the same as that of background(No cell area)
Type 2 : Cell is approaching closer to substrate from a distance far away
Type 3 : Cell remains close to substrate from beginning to end
Type 4 : Cell is moving away from substrate |
|
|
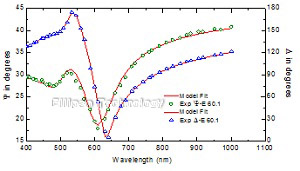
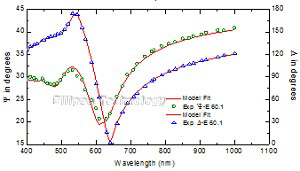
6.3 Analysis of SE data(Type 3) |
[TOP] |
|
| |
When cell remains close to substrate, the distance of cell from substrate and the refractive index of cell are calculated by model analyzing Spectro-Ellipsometric Data. |
|
| |
ROI 11 (Type 3)
| AMBIENT:sf10_schott |
|
| 4 cr_2 |
1.6 nm |
| 3 au_2 |
30.3 nm |
| 2 Fibronectin |
53.3 nm |
| 1 ema water/-1.41% void (Media) |
114.5 nm |
| 0 cauchy (Cell) |
1 mm |
|
ROI 12 (Type 3)
| AMBIENT:sf10_schott |
|
| 4 cr_2 |
1.6 nm |
| 3 au_2 |
30.3 nm |
| 2 Fibronectin |
53.3 nm |
| 1 ema water/-1.41% void (Media) |
104.3 nm |
| 0 cauchy (Cell) |
1 mm |
|
|
|
| |
ROI 17 (Type 3)
| AMBIENT:sf10_schott |
|
| 4 cr_2 |
1.6 nm |
| 3 au_2 |
30.3 nm |
| 2 Fibronectin |
53.3 nm |
| 1 ema water/-1.41% void (Media) |
130.8 nm |
| 0 cauchy (Cell) |
1 mm |
|
|
|
|
7. Ellipsometry with Incoherent Layers |
|
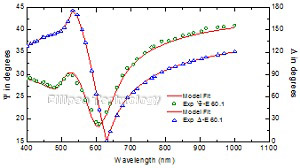
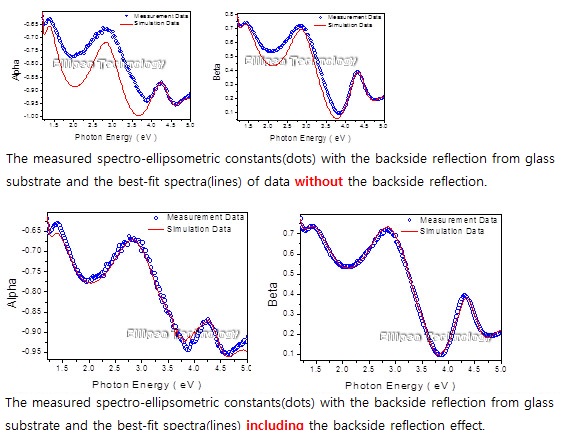
7.1 Ellipsometry with Backside Reflection |
[TOP] |
|
|
| |
|
|
|
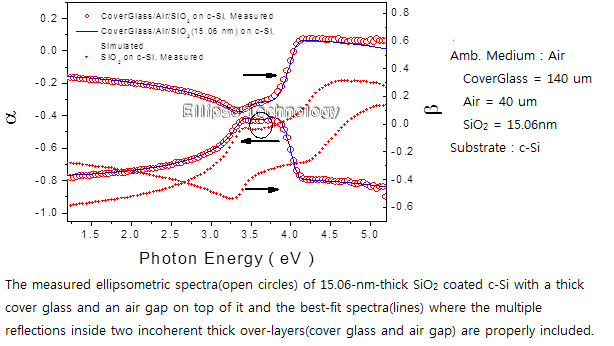
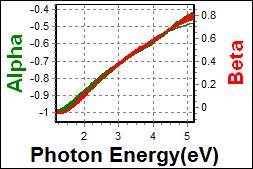
7.2 Ellipsometry with Frontside Reflection |
[TOP] |
|
|
| |
 |
|
|
8. Cathode Materials |
[TOP] |
|
|
| |
|
| |
 |
| Thickness : LiNiOx 85.413 nm |
| R.I. : Dispersion of LiNiOx |
| Substrate : Glass |
 |
|
|
|
9. X-ray Screen Materials |
[TOP] |
|
|
| |
|
| |
 |
| Thickness : WOx 473.044 nm |
| R.I. : Dispersion of WOx |
| Substrate : Glass |
 |
|
|
|
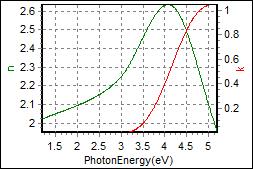
10. Catalyst Materials |
[TOP] |
|
|
| |
10-1. Ru/SiO2 on c-Si (photocatalyst) |
|
| |
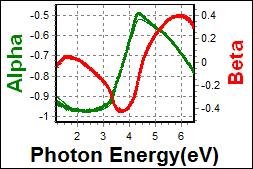 |
| Thickness : Ru 21.699 nm |
| R.I. : Dispersion of Ru |
| Substrate : Crystalline Silicon |
 |
|
|
| |
10-2. Co on c-Si (catalyst) |
|
| |
 |
| Thickness : Co 25.983 nm |
| R.I. : Dispersion of Co |
| Substrate : Crystalline Silicon |
 |
|
|
|
11. Insulating Materials |
[TOP] |
|
|
| |
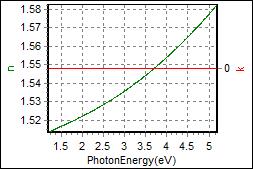
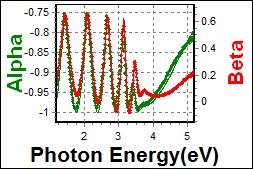
11-1. Parylene N on c-Si (poly-para-xylyene) |
|
| |
 |
| Thickness : Parylene 314.661 nm |
| R.I. : Dispersion of Parylene-N |
| Substrate : Crystalline Silicon |
 |
|
|