|
 |
Analysis of In-situ, Real Time Thin Films – A Few Examples (Ref: Ellipso Technology) |
|
| |
|
|
 |
1. Growth Curve of SiO2 on c-Si |
[TOP] |
|
|
| |
|
| |
| The growth curve of SiO2 in Δ, Ψ plane(left) and refractive index (right upper) and thickness(right lower) variations of SiO2 growth appearing on screen in real time. Substrate is c-Si |
|
|
 |
2. Growth Curve of GST |
[TOP] |
|
|
| |
|
| |
Growth curve of GST(Ge2Sb2Te5) film based on a uniform growth model does not match to that of the real growth curve (left). On the contrary, the growth curve based on a non-uniform growth model matches quite well (right). |
|
 |
3. Growth Curve of ZnS-SiO2, Growth Curve of ZnS-SiO2/GST/ZnS-SiO2 on c-Si |
[TOP] |
|
|
| |
| Growth Curve of ZnS-SiO2 |
Growth Curve of ZnS-SiO2/
GST/ZnS-SiO2 on c-Si |
|
| |
 |
| |
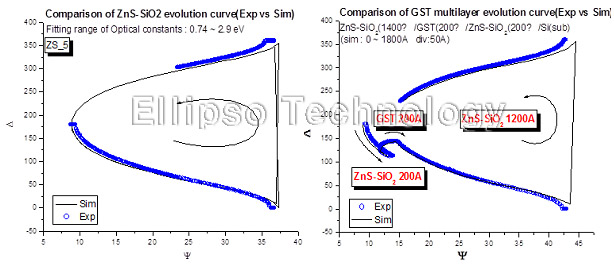
One can verify that ZnS-SiO2 film grows quite uniformly as the evolution curve based on 3-plase model shows quite an excellent match with the measured ellipsometric growth curve(left). The growth curve of multiple layers (ZnS-SiO2/GST/ZnS-SiO2) matches the measured one quite well also(right). |
|
 |
4. Phase Changes of GST : Crystallization and Melting |
[TOP] |
|
|
| |
 |
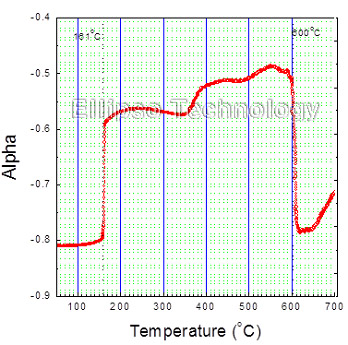
The variation of ellipsometric constant α(Alpha) of GST as temperature is increased monotonically, shows phase change process of GST clearly. The crystallization temperature is 161.0 °C, and the melting temperature is 607 °C. |
|
|
 |
5. Cascaded Crystallization of GST(Ge2Sb2Te5) |
[TOP] |
|
|
| |
|
| |
The ellipsometric isotherms of cosΔ clearly show the characteristic cascaded crystallization of GST followed by incubation time(left). The first stage of crystallization is a 3-dimensonal nucleation dominant one and the second one is an 1-dimensional plate like grain growth one. The speed of cascaded phase transformation of GST depends on temperature such that it proceeds fast at high temperature, and it proceeds slow at lower temperature, but the optical property change of GST at each stage of crystallization is exactly the same even at different temperature(right). (Ref. JAP 86(2), 774, 1999) |
|
 |
6. Cascaded Crystallization of GST-N(Nitrogen Doped Ge2Sb2Te5) |
[TOP] |
|
|
| |
|
| |
As concentration of doped Nitrogen into GST increases, the characteristic property of cascaded phase transition becomes obscured. Nitrogen concentration is 0.0 %, 2.9 %, and 6.8 %, respectively, from left. |
|

